What Seven Country Radars Actually Show: Search Buzz, Prediction Markets and Hiring
An October 18 snapshot contains 70 Google Trending Now topics and 92 Polymarket contracts across seven country panels. We examine event concentration, traffic buckets, source dates and a practical route from a headline to a verified employer watchlist.

A country dashboard can put a search spike, a prediction-market price, a stock move and a vacancy count on the same screen. The proximity is useful for research, but it can create an illusion that the figures measure the same thing. On the morning of October 18, the ApplyDjinn radar offered a particularly clear example: its US panel contained a query about Dario Amodei, while all fifteen saved US prediction contracts belonged to one presidential-election event. Neither observation described a set of current technical openings.
The two photographic-style images in this article are AI-generated illustrations. Numerical figures below are generated from saved data, with the observation times stated separately.
The morning snapshot
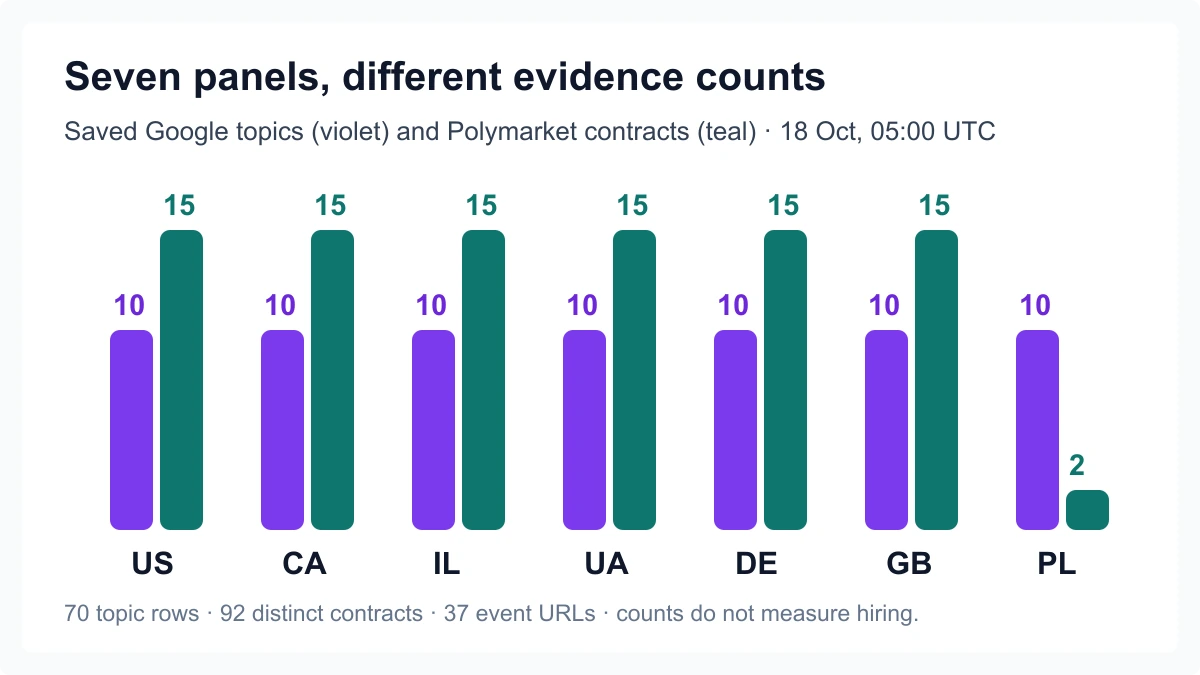
We saved the public country radar feed with a source capture timestamp of October 18, 2026, 05:00:24 UTC. It contained seven panels: the United States, Canada, Israel, Ukraine, Germany, the United Kingdom and Poland. Each held ten Google Trending Now topics. Six panels held fifteen Polymarket contracts; Poland held two. In total, that was 70 saved search-topic rows and 92 distinct contract IDs.
The contracts linked to 37 distinct event URLs. Contract rows therefore did not represent 92 independent events. All fifteen US contract rows linked to one event, the 2028 US presidential-election winner market. Israel's fifteen rows linked to two events. At the other end, Canada's fifteen rows linked to nine event URLs. The count of visible cards depends partly on how a publisher organizes outcomes within events.
| Country panel | Saved search topics | Saved contracts | Distinct event URLs | Catalog roles in that panel |
|---|---|---|---|---|
| United States | 10 | 15 | 1 | 7,462 |
| Canada | 10 | 15 | 9 | 565 |
| Israel | 10 | 15 | 2 | 1,030 |
| Ukraine | 10 | 15 | 9 | 1,308 |
| Germany | 10 | 15 | 6 | 445 |
| United Kingdom | 10 | 15 | 8 | 923 |
| Poland | 10 | 2 | 2 | 971 |
These role counts belong to the radar's captured catalog view. A listing can qualify for several countries, so the country column must not be summed into a unique global total. The panels are selected coverage, not a survey of every country. Having ten saved topics also does not establish that a country had only ten topics or that the saved order is a universal popularity ranking.
A Google search spike needs its own interpretation
Google's Trending Now documentation describes recent surges, grouped queries and traffic buckets within a selected period. The familiar normalized Explore chart and a Trending Now traffic label are different presentations. A saved label such as 500+ should retain its bucketed form and context. It is not an exact number of job seekers or a clean measure of the size of an employer's addressable market.
In the saved US set, dario amodei carried 500+, while ap poll predictions carried 5000+. The latter query can be ambiguous without opening its source context. It would be unsafe to label it an AI or labor-market poll merely because it appears in a research dashboard. The former is a person's name, which should not be silently converted into a company hiring signal.
The Israel set included several weather-related queries in different languages, alongside other subjects. Translating them into one language would not make them independent events or comparable national opinion. The Canada set mixed government-debt interest, sport and local-election queries. The point is not to dismiss those subjects. It is to keep a general-interest feed from being mislabeled as a technology-demand survey.
For employer research, open the trend's source context and identify what actually changed. A product launch, lawsuit, interview or sporting result could all produce attention. Save the date and the verified entity before making an association. The search feed is a useful place to find a question; answering it requires another source.
Fifteen contracts can describe one event
The US panel's concentration is an instructive example of selection effects. A long event with many possible winners can occupy a panel that is capped at a fixed number of contracts. Seeing many political cards does not prove that political uncertainty displaced technology activity, and seeing few employer names does not prove that no employer-related market existed elsewhere on the platform.
The right unit depends on the question. Contract count describes how many outcome records a product saved. Event count describes how many event pages those records point to. A count of verified companies mentioned would describe something else again. Keep those units separate when comparing countries or drawing a weekly chart.
This is also why a panel should not be padded to a target length. Poland's two saved contracts concerned football competitions. Filling the other thirteen slots with loosely related or closed contracts would make the layout look complete while weakening the evidence. A bounded list is a limit, not a promise of fifteen relevant observations in every country at every time.
Read a price as a dated market observation
In the Canada panel, the contract asking whether the Bank of Canada would leave its overnight target unchanged at the October announcement had a saved value of 0.812, conventionally displayed as 81.2%. That was the value in our 05:00 UTC observation. It was not a new official bank statement, a hiring probability or a promise about how the event would resolve. The event page can change after the snapshot.
Polymarket's explanation of displayed prices describes order-book midpoints, with a last-trade fallback when the spread is wide. The visual percentage is consequently a market-derived quotation. To interpret a particular contract, inspect its question, deadline, resolution conditions and available market information. This article uses those quotations as research context and makes no recommendation to trade.
A further detail in the saved Canada panel is worth noticing: a tariff-agreement question referred to October 31 while its event URL retained an older August-31 slug. The URL is an identifier, not a complete statement of the current contract terms. Reading only a link slug can therefore introduce a factual error even when the link itself is genuine. Check the current question and rules at the publisher.

From a signal to an employer watchlist
A useful watchlist has a reason for inclusion and a next check. Suppose a trend leads you to investigate an AI company. First verify the entity and the underlying announcement. Then open its company profile and inspect current roles that match your specialty and permitted location. Keep the announcement date and the vacancy date in separate fields.
For comparison, our separate read-only catalog snapshot at 06:19 UTC contained 170 current records at Anthropic, of which 83 were classified as technical. It contained 2,367 at Google, including 1,228 technical records, and 1,026 at NVIDIA, including 848 technical records. Those are connected listing counts using the catalog's current-window rule. They do not establish a causal response to this morning's searches, and they should not be described as new hires created by the week's news.
The two observation times matter. The radar was captured at 05:00; the catalog research transaction began later. Treating them as a synchronized experiment would conceal normal parser updates and differences in source coverage. They are separate dated observations that can help decide what to investigate next.
Company identity is the join key
A person, product and company can be related without being interchangeable entities. A search about a founder may concern a personal interview. A prediction about a named executive may concern politics. A brand word may also be an ordinary noun. Matching short strings indiscriminately can attach the wrong event to an employer and make a sparse profile look more active than the evidence permits.
A defensible association records the verified company ID, the matching name or alias, the source URL and the observation time. Person-to-company relationships need their own verified mapping and context. Country matching needs the same care: a contract that mentions Germany is not automatically evidence about a German engineering role, and a multinational requisition can span several applicant countries.
As a reader, a simple check is to open one associated signal and ask whether the company is actually the subject. If the relationship is indirect, the product should explain it. If the subject cannot be established, leave it unassociated. A missing link is easier to correct than a confident but false story about an employer.
A worked research note
Here is a hypothetical way to turn the saved data into a useful application note. Start with a query about an AI industry participant. Open a primary source describing the relevant event, and write one sentence saying what was actually announced. Next, choose one live technical opening at a relevant employer. Record its source identity, location requirements and two tasks you can discuss from experience.
Now add the external signal in a separate context field. If it is a search spike, retain the traffic bucket and observation time. If it is a prediction contract, retain its exact question and source page. Do not add those values to the role count or average them into an employer score. Their job is to suggest an interview question or a follow-up source, not to rank your probability of receiving an offer.
End the note with an action and a reason: verify the requisition, tailor a project example, or revisit the employer next week. If there is no suitable role, the action may simply be to follow the team. That is a valid result. A dashboard should help you avoid unsupported applications as well as find promising ones.
How to make a meaningful weekly comparison
Preserve the same country set, selection method and observation schedule. Record source failures and changes in the maximum number of returned items. Compare contract IDs with contract IDs and event URLs with event URLs. If a panel changes from ten topics to fifteen, a rise in row count is partly a product-coverage change, not evidence of more public attention.
For hiring, compare the same cohort of employers or explicitly show newly connected sources. Use original publication dates where available and disclose the fallback when they are missing. Track role closure and source verification separately from first discovery. A new parser can discover an old listing; a noisy news week can occur while the relevant hiring pipeline stays unchanged.
The current saved radar includes historical observations, but this article does not use them to estimate a causal relationship between attention, prices and hiring. Such a study would require a defined sample, comparable timestamps, a treatment of missing data and a method that addresses alternative explanations. A visually appealing set of lines alone would not supply that argument.
What to do with the radar today
Use the feed to choose a small number of questions worth investigating. Open the strongest primary source, confirm the entity and inspect a current role. Keep your own skills and location constraints in the decision. The best signal is often the one that changes a concrete action: a better question for an interview, a verified application target, or a reason to postpone an unsupported conclusion.
The October 18 snapshot is useful precisely because its limits are visible. Seventy search rows, ninety-two contracts and thirty-seven event URLs describe different objects. Putting them beside hiring evidence creates a productive research workspace when each number retains its source, unit and time.
Sources and reproducibility
- ApplyDjinn public country radar, captured October 18, 2026, 05:00:24 UTC. The frozen response, contract IDs and derived counts accompany this article's repository source. Live data changes.
- Google Trending Now documentation and Google Trends data FAQ. Traffic buckets, clustered searches and normalized Explore values require distinct interpretations.
- Polymarket's displayed-price explanation and the Bank of Canada October event. Contract rules and live quotes remain at the publisher.
- ApplyDjinn read-only catalog snapshot, October 18, 2026, 06:19 UTC; methodology, trends and research authorship. Country footprints can overlap, and catalog coverage is not the full labor market.