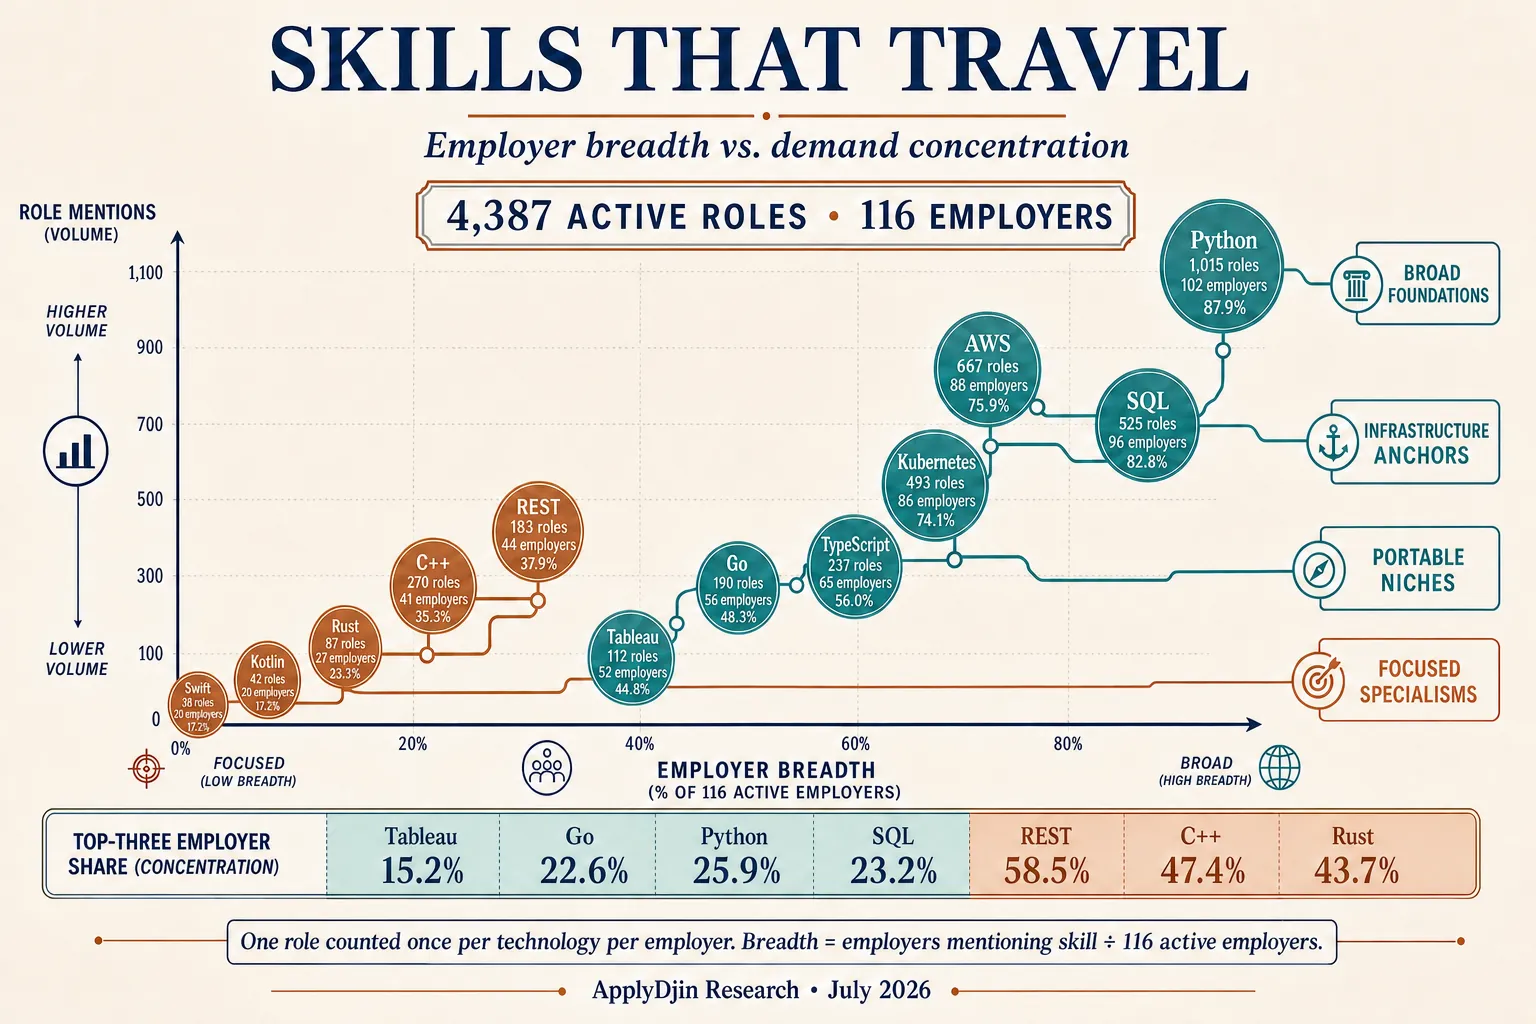
Skills That Travel: The Employer-Breadth Map of Tech Hiring
Across 4,387 active roles and 116 employers, raw demand tells only half the story. Employer breadth reveals which skills create real optionality—and which counts depend on a few hiring programs.
A skill can be popular without being portable.
Suppose a technology appears in hundreds of open roles. That sounds like a strong market signal—but the count alone does not tell you whether demand is spread across the market or concentrated inside one unusually active employer. If half of those roles come from one company, the opportunity set is more fragile than the headline suggests.
The reverse can also be true. A skill with a smaller role count may appear across dozens of employers, giving candidates more ways to change industries, company sizes, products and teams.
That distinction is the idea behind employer breadth: not only “How many jobs mention this skill?” but “How many different employers are hiring for it?”
ApplyDjin’s current materialized snapshot contains 4,387 active roles across 116 employers. The active-role totals and technology materialization match, so every comparison below comes from the same catalog slice.
The result is a map of skills that travel: foundations with near-market-wide reach, infrastructure anchors connecting many engineering environments, portable niches whose modest volume hides unusually broad adoption and specialist technologies whose demand is real but more concentrated.
This is not a ranking. We deliberately do not collapse the data into a composite score. Volume, breadth and concentration answer different career questions. Their importance depends on whether you want maximum optionality, a focused specialty, a resilient search or access to a particular kind of employer.
The four metrics behind the map
Each skill is viewed through four separate lenses:
A skill can behave very differently across these dimensions. Docker has 277 role mentions and reaches 61 employers, but its largest employer supplies 30.7% of those roles. Go has only 190 role mentions and reaches 56 employers, yet its largest employer contributes just 8.4%.
Docker has more visible demand. Go’s demand is more evenly distributed. Neither fact cancels the other.
The employer-breadth map
The full selected set, ordered by employer reach, is:
Broad foundations: Python and SQL
Python has the clearest combination of scale and reach in the snapshot. Its 1,015 roles span 102 employers, or 87.9% of the catalog. Its largest employer accounts for only 10.7% of Python roles, while the top three account for 25.9%. Python is therefore not merely abundant; its demand is distributed across many independent hiring pipelines.
SQL shows a similar breadth signature from a different demand base. It appears in 525 roles across 96 employers—82.8% of the market—with 23.2% of its roles concentrated among the top three. The role count is roughly half Python’s, yet its employer reach is only six companies lower.
This is what a broad foundation looks like. The value is not that either skill defines a single job title. It is that each participates in many job families and company contexts. A foundation increases the number of plausible directions in which a profile can develop.
Breadth does not mean every Python or SQL vacancy is interchangeable. A data-platform role, an automation role and a backend role may require very different depth. The signal is optionality: these skills create many starting points, after which domain knowledge and adjacent technologies determine fit.
Infrastructure anchors: AWS, Kubernetes, Docker and Terraform
AWS and Kubernetes form the next high-breadth layer. AWS appears in 667 roles at 88 employers, while Kubernetes appears in 493 roles at 86. Both reach roughly three-quarters of the catalog, and their top-three concentration remains below 30%.
That pairing matters because it shows infrastructure knowledge traveling beyond a narrow platform-engineering niche. The data does not say every matching vacancy is an infrastructure role. It says cloud and container-orchestration vocabulary appears across a broad employer set.
Docker and Terraform share an employer count—61 companies, or 52.6% breadth—but their concentration profiles differ. Docker has more roles, 277 versus 203, yet 30.7% of Docker demand comes from one employer and 41.5% from the top three. Terraform’s corresponding shares are 21.2% and 30.0%.
Docker currently has greater volume. Terraform’s observed demand is less dominated by its largest sources.
Linux supplies another warning against reading role counts alone. Its 308 roles exceed Terraform, TypeScript and Go, but they span only 56 employers, and 40.9% come from the top three. Linux remains an important operating foundation; the snapshot simply shows that a meaningful part of current vacancy volume sits inside a smaller group of active employers.
Infrastructure skills are strongest as bridges rather than isolated keywords. AWS plus Kubernetes tells a clearer story than either alone. Terraform adds reproducibility and platform ownership. Linux adds operational depth. The combination describes what a candidate can build, deploy and operate.
The application layer: similar breadth, different shapes
TypeScript reaches 65 employers, the highest breadth below the dominant foundations and infrastructure anchors. Its 237 roles are fewer than Java’s 308, but it appears at three more employers and has lower concentration: 16.0% at the largest employer and 26.6% among the top three, compared with Java’s 23.7% and 33.4%.
JavaScript, React.js and Node.js occupy a compact breadth band. JavaScript appears at 60 employers, React.js at 59 and Node.js at 57. Their role counts are also close—197, 200 and 192.
Yet Node.js has the lowest top-one concentration of the group at 12.0%, suggesting its current demand is not dependent on one dominant employer. React.js has the lowest top-three concentration at 27.5%.
These numbers support a portfolio view of the web stack. A single framework can be useful, but adjacent coverage expands the number of credible role narratives. TypeScript can connect browser, server, tooling and platform work. React.js makes a frontend direction legible. Node.js creates a backend or full-stack bridge.
The employer overlap between them is not measured here, so the figures are not proof that every company wants the whole bundle. They show that each component independently travels across a substantial part of the catalog.
Portable niches: Go and Tableau
Some of the most interesting signals are not at the top of the role-count table.
Go appears in 190 roles across 56 employers, giving it 48.3% breadth. Only 8.4% of its roles come from the largest employer and 22.6% from the top three. That is a highly distributed demand pattern: less overall volume than Java or Python, but participation from nearly half the tracked employers without dependence on a single hiring surge.
Tableau is even more striking. It appears in only 112 roles, yet those roles span 52 employers—44.8% of the catalog. The largest employer contributes just 5.4% of Tableau roles and the top three only 15.2%, the lowest concentration figures in this selected set.
This is the difference between a small market and a portable niche. A genuinely narrow skill has both low role volume and low employer reach. A portable niche has moderate or low volume but appears repeatedly across independent companies.
Such a skill can be valuable when paired with a broad foundation: Python plus Go for backend and platform work, or SQL plus Tableau for analytics and business intelligence.
Focused specialists: concentration changes the reading
Kafka and PostgreSQL each reach 46 employers, but their concentration patterns differ. Kafka’s largest employer supplies 30.5% of its 167 roles. PostgreSQL’s largest supplies 20.7% of 164 roles, though both become more concentrated when the top three are combined. These are multi-employer skills, but their current volume is more clustered than Go or Tableau.
REST is the clearest example of why a large count can mislead. It appears in 183 roles across 44 employers, but one employer accounts for 51.4% of those roles and the top three for 58.5%.
REST clearly exists beyond that employer. The point is that 183 catalog mentions are not 183 equally independent market signals.
C and C++ have substantial volume—238 and 270 roles—but reach 42 and 41 employers. Their top-three concentration rises to 41.2% and 47.4%. They offer real opportunity, especially for profiles with the right systems context, but their employer map is narrower than their role totals might imply.
Rust is smaller at 87 roles and 27 employers. Its top-one share is a moderate 16.1%, while its top-three share reaches 43.7%. That pattern describes a multi-company niche with a meaningful cluster of demand among several leading employers rather than dependence on one.
Kotlin and Swift each reach 20 employers despite having only 42 and 38 roles. Their top-one concentration remains comparatively low at 11.9% and 15.8%. They are focused ecosystems, but the available roles are not monopolized by a single company. For a mobile specialist, that distinction matters more than comparing their raw totals with Python.
A practical portfolio: foundation, bridge, niche
The data suggests a simple way to design a resilient skill portfolio without chasing every popular keyword.
Start with a broad foundation. Python or SQL provides the widest employer reach in this snapshot. TypeScript can play a similar role for a web-focused profile, though its breadth is lower.
Add a bridge skill connecting the foundation to a production environment. AWS, Kubernetes, Terraform, Linux, React.js or Node.js can make the profile’s operating context clearer. The right bridge depends on the work you want to do, not on which row has the largest number.
Then choose a niche that creates differentiation. Go, Tableau, Kafka, PostgreSQL, Rust, Kotlin or Swift can narrow the story in a productive way. The niche should reinforce the target role rather than merely add another logo to a résumé.
That produces coherent examples:
These are portfolio examples, not claims about skill co-occurrence. The report measures each technology independently. Its purpose is to help candidates balance reach with specialization.
Before making a large learning investment, ask three market questions:
The answers are more useful than a leaderboard position.
What the snapshot cannot tell us
This is a current ApplyDjin catalog snapshot, not a census of the entire technology labor market. The 116 employers are those represented in the active catalog, and their hiring intensity is not equal.
Job descriptions also differ in detail. A technology may be used internally without appearing in a posting, while another may be mentioned as optional, contextual or part of a long tooling list. Taxonomy and alias normalization improve consistency but cannot remove every ambiguity.
Employer breadth gives every employer one count regardless of company size. That is intentional—it measures reach—but it does not measure team size, hiring velocity, compensation, role quality, seniority, location or the probability that a particular candidate will receive an interview.
Concentration is also a snapshot metric. A company opening or closing a large hiring program can change the top-one and top-three shares. A capped or filtered career source can affect visible volume. These figures are not a forecast.
Most importantly, there is no universal best balance among demand, breadth and concentration. A specialist may rationally prefer a narrower market with high technical fit. A career switcher may value breadth more heavily. A candidate targeting one employer may care little about distribution.
The takeaway
Raw demand tells you how loud a skill is. Employer breadth tells you how far it travels. Concentration tells you how much of the noise comes from a few places.
Python and SQL combine scale with exceptional reach. AWS and Kubernetes act as broad infrastructure anchors. Go and Tableau show how a smaller niche can travel surprisingly well. REST demonstrates how a strong role count can be shaped by one employer, while C++, Rust, Kotlin and Swift reveal different forms of focused specialization.
The strongest career portfolio is not necessarily the one with the most popular individual skill. It is the one that combines a broad foundation, a credible bridge into production work and a niche that gives employers a reason to remember you.
Method: company technology coverage across 4,387 active roles at 116 employers in the ApplyDjin catalog on July 13, 2026. One role counts once per technology. Breadth is employers mentioning a technology divided by 116 active employers; concentration is the share of role mentions at the largest one or three employers. Counts overlap across technologies.